Earlier in the semester, a survey was done on a sandbox to get information about elevation (See Lab 1) . This lab will use this data to visualize what the sandbox actually looks like. Before any data can be used, it needs to be normalized into a fashion that can be used in ArcMap. Data normalization is putting data into a generally accepted format. There were many ways to collect the sandbox elevations and if they are not normalized into the proper format, ArcMap will not accept or understand them. In ArcMap this format consists of an X location column, a Y location column, and a Z value column. This will then allow the user to input the XY data as spatial points. In our lab, we took a z value for every 6 cm in the x and y direction. When these points are put into ArcMap, it will create a grid with points every 6 cm. Each of these points will have a z value associated with it, the computer will then need to fill in the gaps between the points. In order to do this a few different methods will be used, IDW, Natural Neighbors, Kriging, Spline, and TIN. A description of each method will be given in the methods section.
Methods:
Fortunately we collected the data in a matter that required no data normalization. It was already formatted properly and ready to get imported into ArcMap.
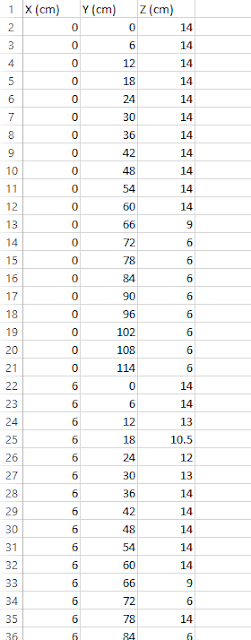 |
| Figure 1: Excel Sheet |
The next step was to import the tabular data into ArcMap. This was done by using the Add XY Data tool. This feature was then exported into a geodatabase and saved with the proper name. This data was given no coordinate system because it has no coordinate system. A 114 cm x 114 cm sandbox is being mapped, this grid is its own "coordinate system" (figure 2). This data is now ready to be used to create elevation models.
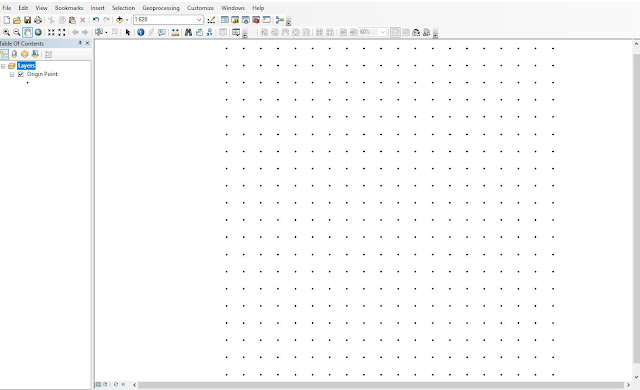 |
| Figure 2: Data Points |
The first method used is IDW or inverse distance weighted interpolation. IDW makes that assumption that points that are closer together are more alike than those that are farther apart.
The next method that will be used in natural neighbors. Natural neighbor only uses the points near it to determine how the area should look. It does not infer trends and will not create peaks, valleys or ridges.
The next method that will be used in natural neighbors. Natural neighbor only uses the points near it to determine how the area should look. It does not infer trends and will not create peaks, valleys or ridges.
The next method used was the kriging method. This method uses a statistical equation to determine the shape of the area. It uses a formula based on the whole data set and points near each other to determine the overall shape. Unlike IDW and spline, the kriging method actually uses math to predict what the surface will look like.
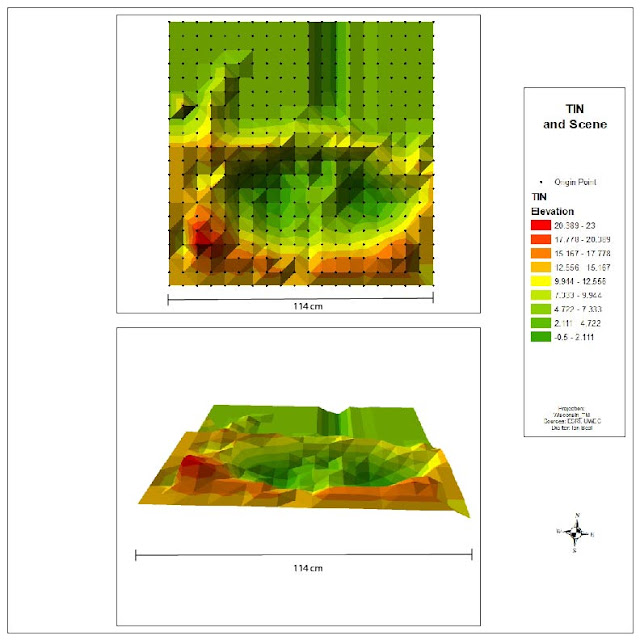
The final method used is a TIN or triangular irregular networks. Unlike the other methods, a TIN is a vector data set where as the other methods create raster images. A TIN basically takes each point and connects them using a flat surface. This results in a clunky non flowing model.
Once a raster was created for all the methods (except TIN), the hill shade tool was ran to create a hillshade for each of the rasters. The hillshade was then overlaid on the raster and given 30% transparency to give the image more depth. This can be seen in the top image of all the maps below.
Finally a 2D scene was made for each of the interpolation methods. This was done by bringing in the raster to ArcScene and setting the elevation from surfaces to floating on a custom surface. This gave the image a 3D appearance by using the surface created in ArcMap.
 |
| Figure 3: Elevation from surfaces |
Results:
The IDW method created a raster with visible "bumps" where each of the points were. It did not create a seamless surface. The IDW method was not really the right method in this situation because it weights points that are closer together heaver than other points but in this lab all the points are equidistant from each other.
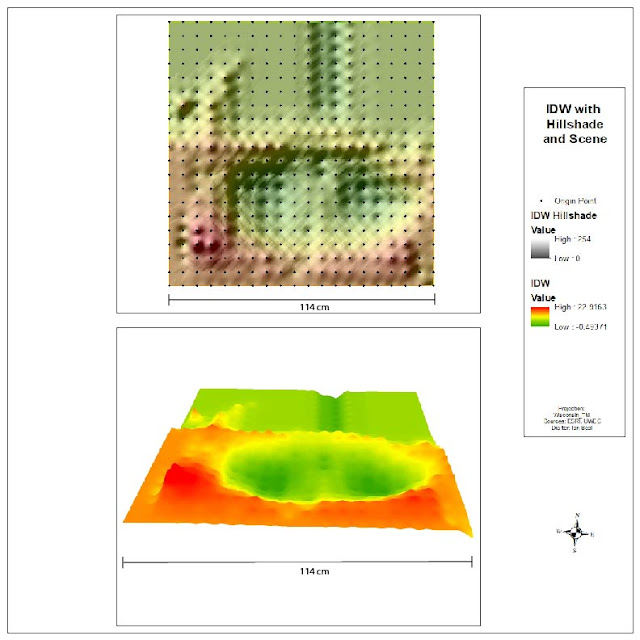 |
| Figure 4: IDW |
The natural neighbors method did a pretty good job of recreating the sandbox. None of the points are too harsh and none of the valley and ridges are over defined. Since natural neighbors only uses the points near it, it properly created all the peaks and valleys that were really in the sandbox. There are a few sections where it looks like natural neighbors created dimples in the surface.
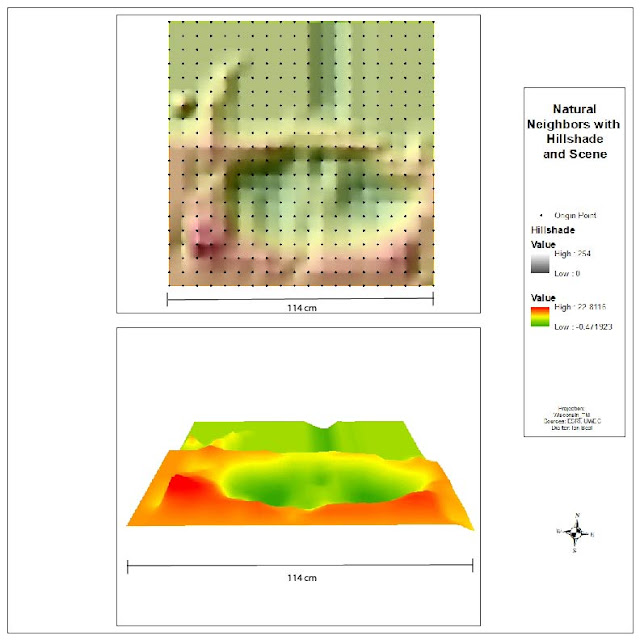 |
| Figure 5: Natural Neighbors |
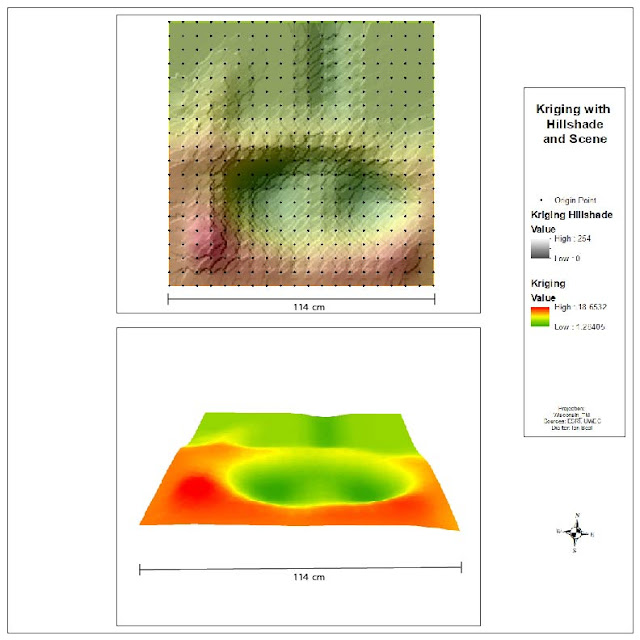 |
| Figure 6: Kriging |
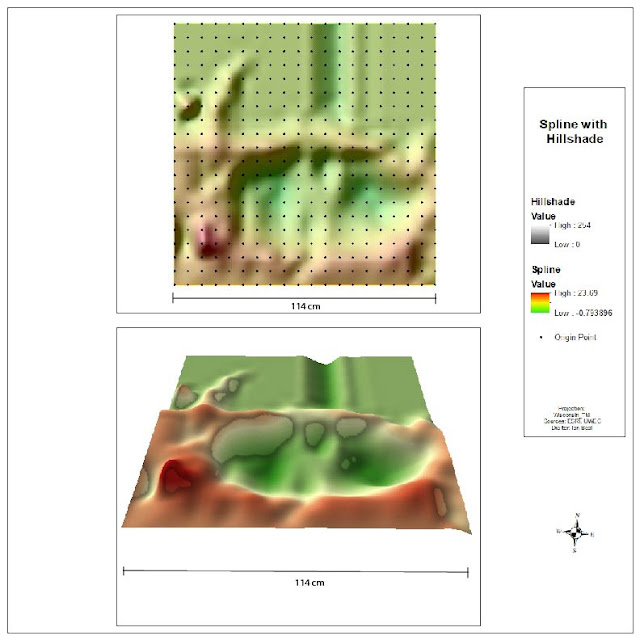 |
| Figure 7: Spline |
Finally the tin is what can be expected from a TIN. It got all the points right but fails to fill in the gaps with a curved surface. A TIN only uses flat vectors and gives a choppy appearance.
 |
| Figure 8: TIN |
Of all the methods the spline method created the most realistic surface model. The 2D surface model created in ArcScene almost looks like a sheet of plastic was draped over the sandbox. The spline method did such a good job because the sandbox had no sharp corners or big steep drop offs. If there was a sheer wall or cliff in the sandbox, the spline method would have curved that surface. Since we did not include any surface like this the spline method did a good job. The natural neighbor method did the second best job. It looks similar to what our sandbox actually looked like with the exception of creating slightly less steep slopes and having a few dimples. Each of the methods used above has its advantages and disadvantages for each situation. They are all powerful but need to be used in the right application. In this situation the spline method ended up being the best method.
No comments:
Post a Comment